
Public interest
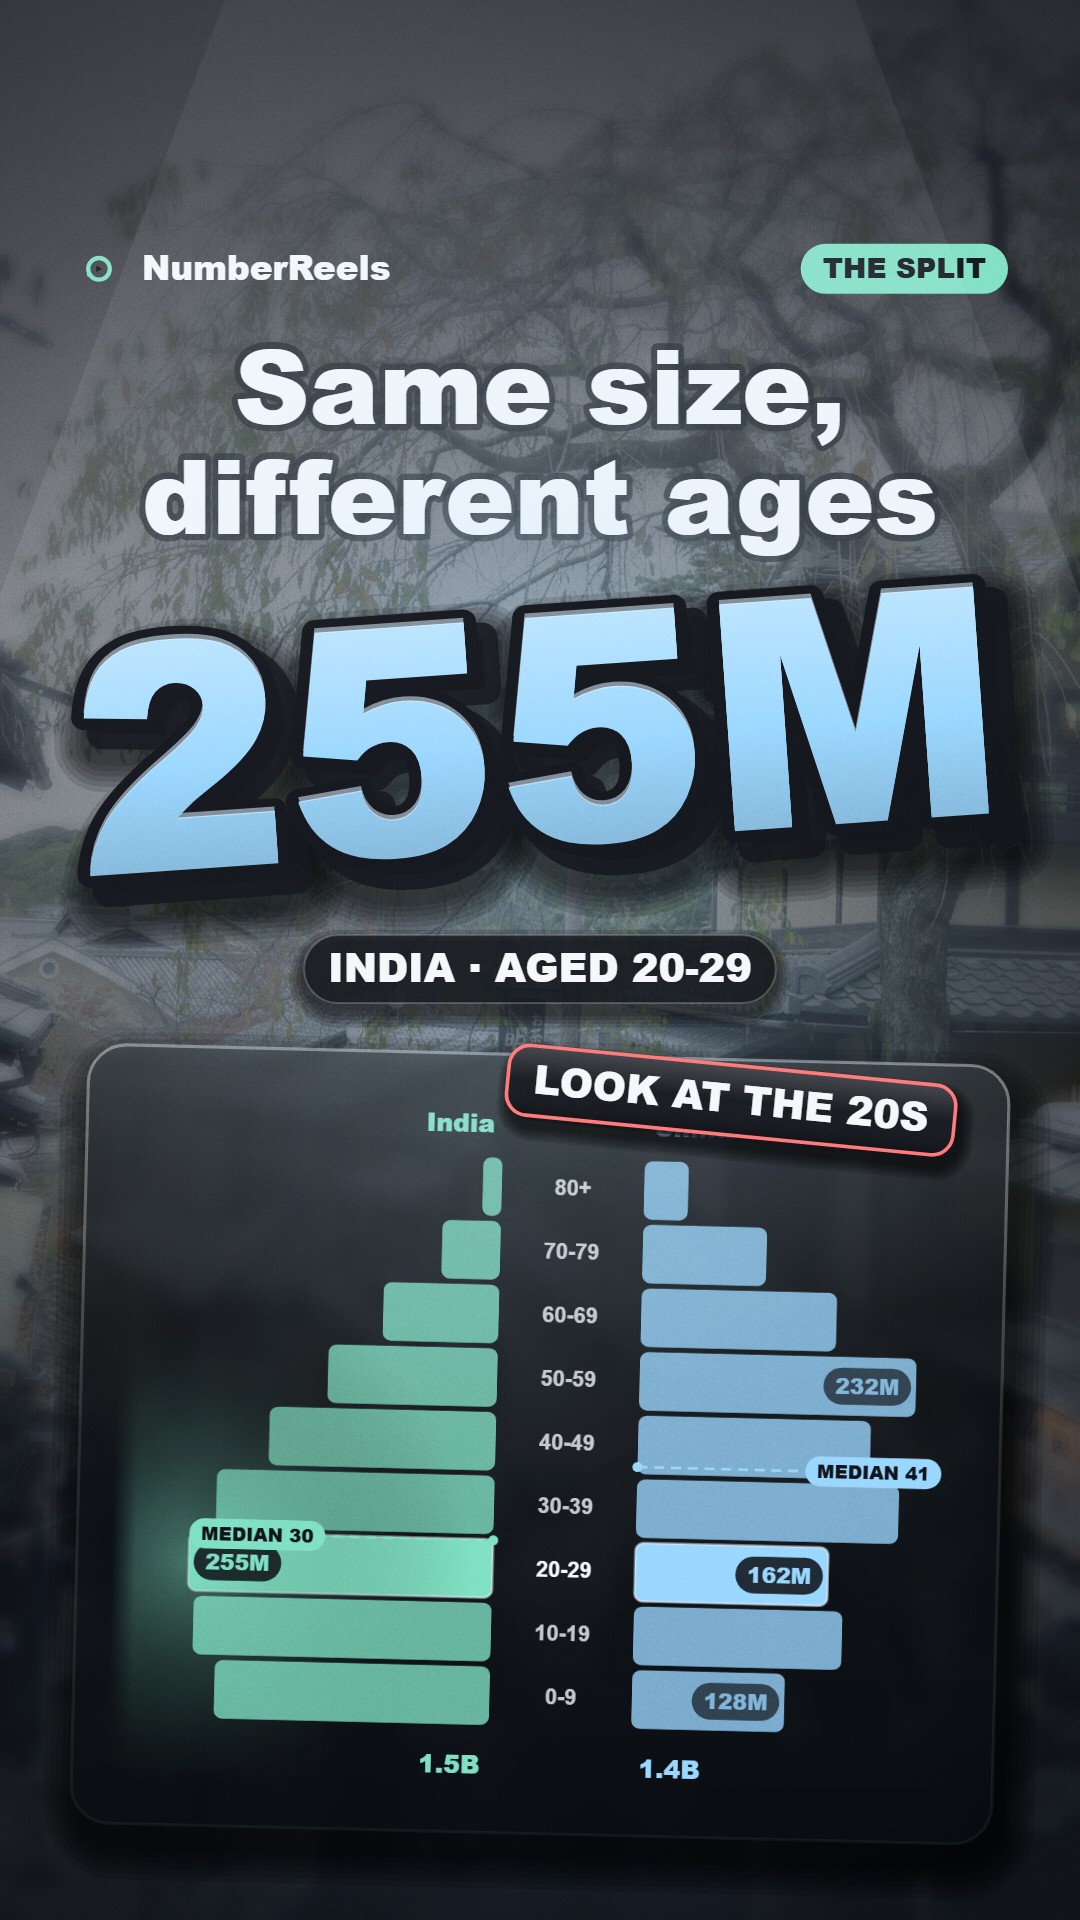
India vs China: two very different age pyramids
0:31 · Pyramid · 2025
Episode 77Stat cards1:02
1980 vs today, on four measures
Source: IMF World Economic Outlook, Apr 2026 (population, GDP; 2026 figures projected); UN World Population Prospects 2024 and World Urbanization Prospects 2025, via World Bank (life expectancy, cities) · 2026
Follows the clip · tap a line to jump
Runs 1:02.
How to read this chart: Independent facts pass through one at a time, then land together in a closing recap. They share a theme, not a scale — do not read the second card as bigger than the first. Where a card carries a ring, a from-to bar, a dot strip or a sparkline, the graphic is zero-based and only ever shows that card's own figure; a "vs" card compares just its two halves. More on stat cards charts.
That 5.3× is at market exchange rates; adjusted for prices (PPP), China's lead is about 2.5×.
5.3 times the GDP per person. In 1980, both earned under 310 dollars a head.
In 1980, India had 687 million people and China 987. Today it is 1,477 million against 1,402. Then, 23.5 percent of Indians lived in cities, and 19.4 percent of Chinese. Now it is 35.7 against 66.3. Life expectancy was 53.6 years and 64.2. Today it is 72.2 and 78. GDP per person was 271 dollars and 308. Today it is 2,813 against 14,874, a gap of 5.3 times. Two very different paths since 1980.
That's today's stat from NumberReels. Can India close that gap by 2050? Like, share and subscribe for more at numberreels.com.
Related
Public interest
0:31 · Pyramid · 2025

0:35 · Stacked bars · after the 2026 US Open
Sports analytics
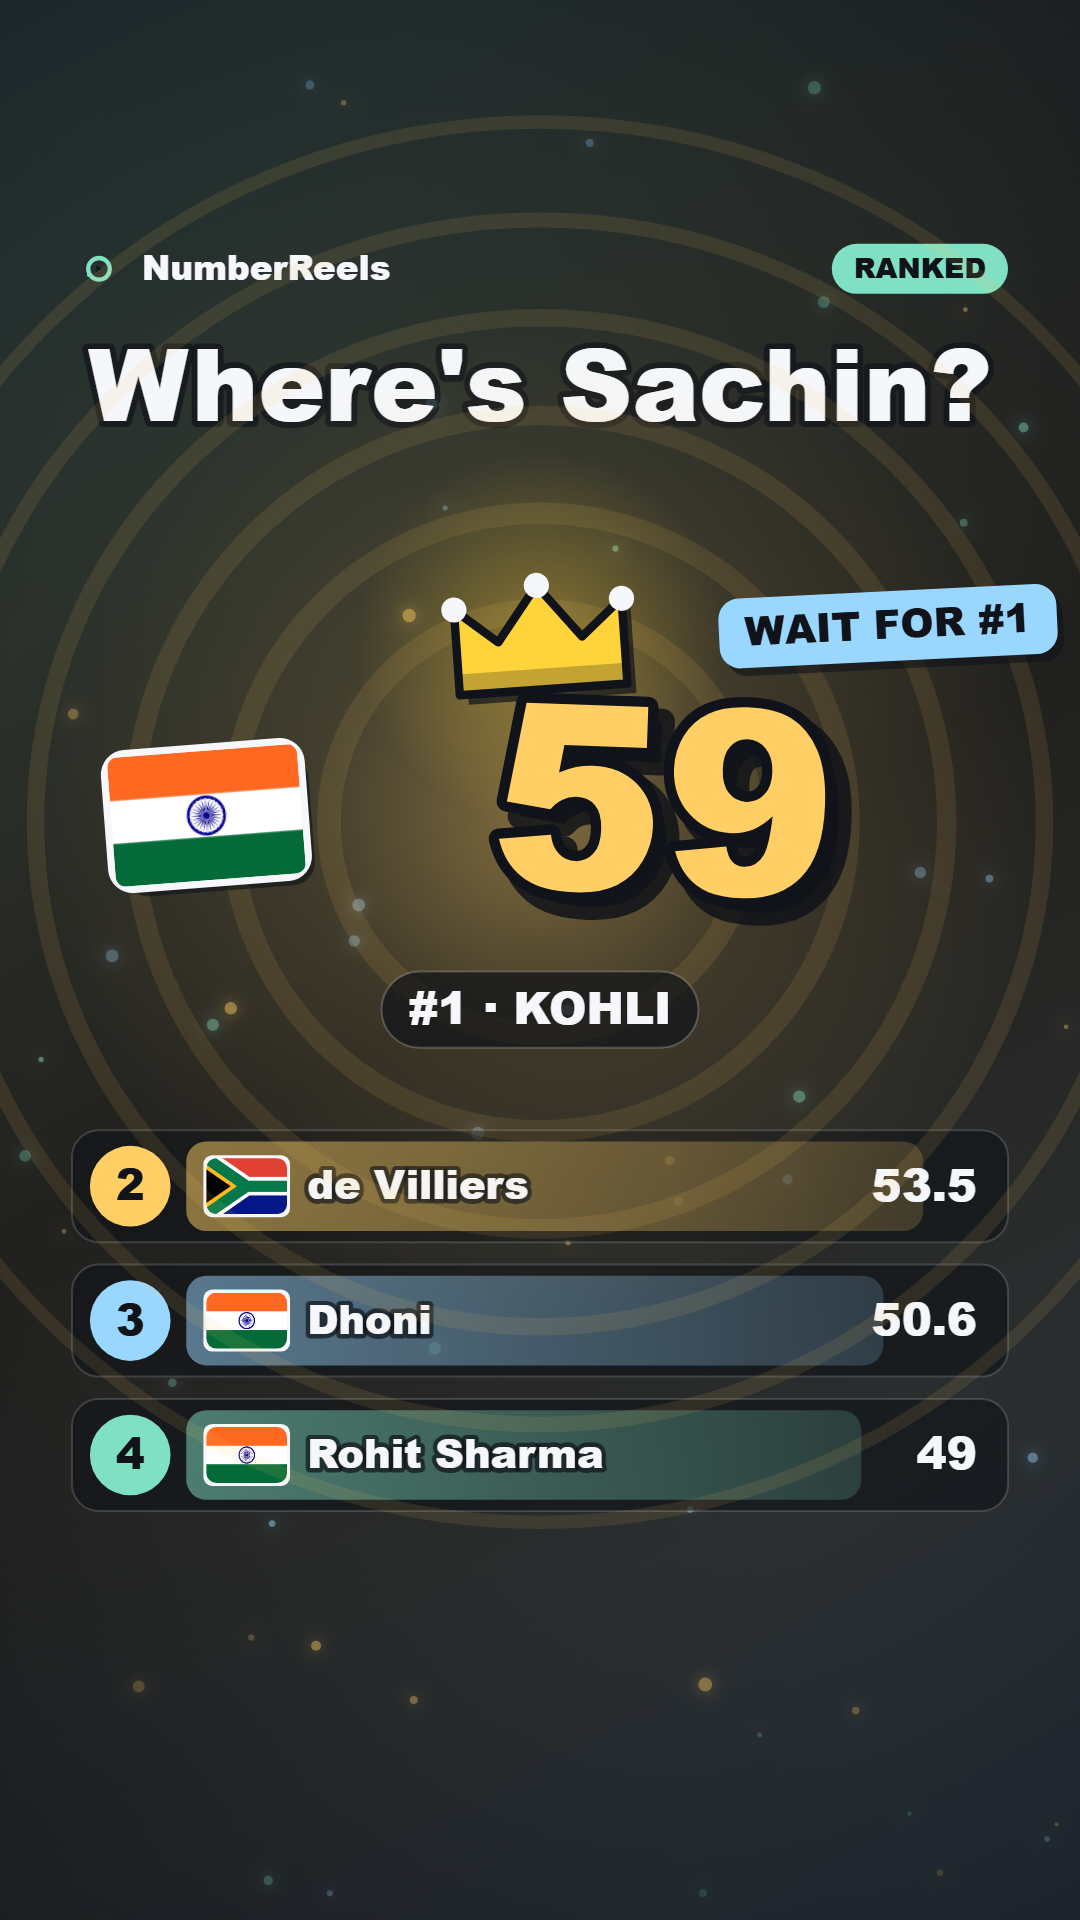
0:35 · Ranked bars · 30 September 2026

0:36 · Ticker · 2025
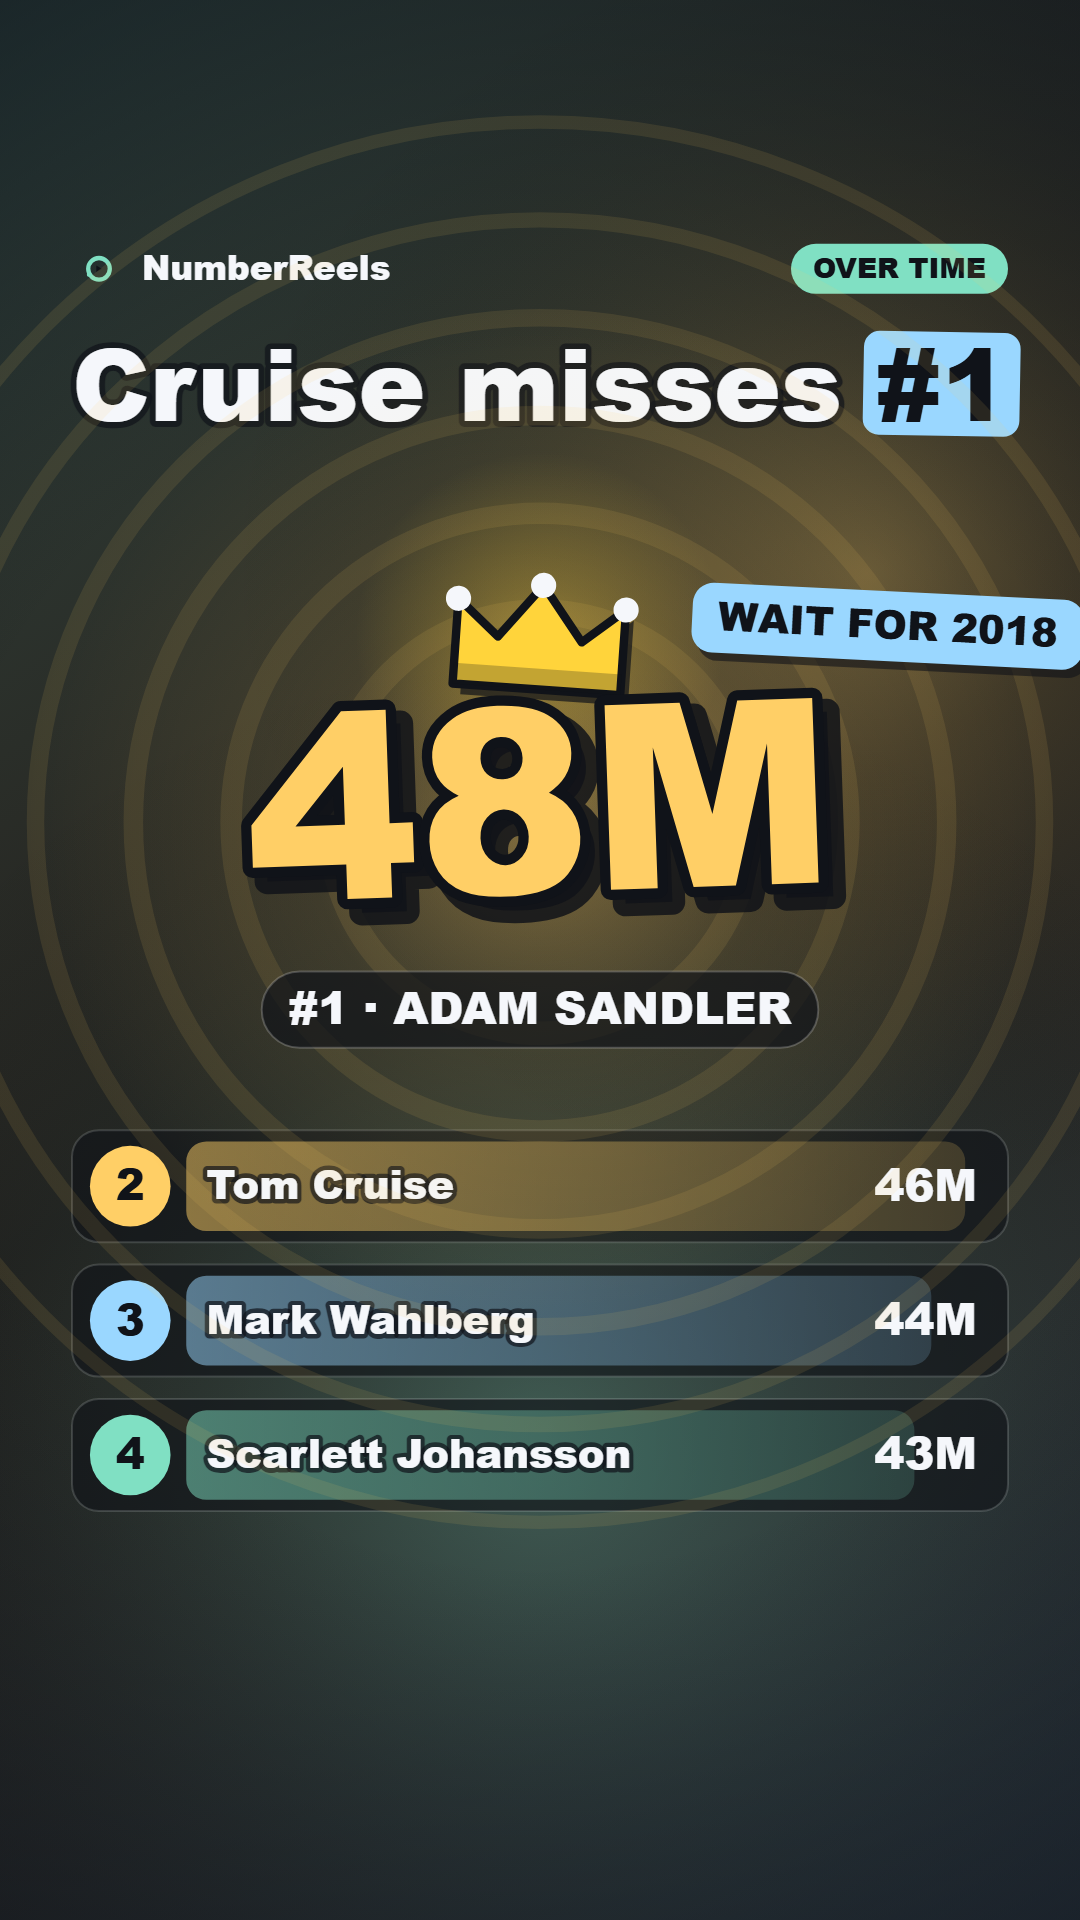
0:42 · Bar race · Mar 2026

0:26 · Quiz reveal · 2025